 |
 |
 |
|
|
MEASURING SETTLEMENT INTENSITY AND DISPERSION
IN THE PREHISTORIC MOJAVE DESERT
by
Don Laylander
| Paper presented at the 2002 Kelso Conference on the Archaeology of the California Desert, Red Rock Canyon State Park |
 |
 |
 |
|
|
MEASURING SETTLEMENT INTENSITY AND DISPERSION
IN THE PREHISTORIC MOJAVE DESERT
by
Don Laylander
| Paper presented at the 2002 Kelso Conference on the Archaeology of the California Desert, Red Rock Canyon State Park |
Abstract: Two of the key dimensions in prehistoric settlement patterns are the amount of activity that occurred within a region during a particular period, and the extent to which that activity was concentrated in a few locations or was dispersed widely across the landscape. The advantages and disadvantages of several methods for measuring relative settlement intensity and dispersion are considered, and a new formulation is proposed, taking into account the available evidence concerning rates of site reuse. Basgall (2000) used a sites-per-millennium statistic to propose that settlement at Fort Irwin was much more dispersed during the latest periods than it had been during the early or middle Holocene. According to the calculation favored here, the increase in Late Prehistoric settlement dispersion was less than suggested by Basgall.
* * * * * In a recent paper on "The Structure of Archaeological Landscapes in the North-Central Mojave Desert," Mark Basgall (2000) used the large body of survey and excavation data that had been amassed at Fort Irwin up to 1994 to argue that settlement during the late Holocene period became much more dispersed at numerous small sites that had been true during the early or middle Holocene. The argument for greater dispersion was essentially based on the occurrence of diagnostically late projectile points at about five to ten times as many locations per thousand years of period length. It is the use of that statistic--sites per millennium--that is reevaluated here.
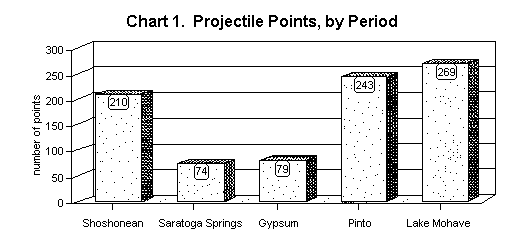
For efforts to quantify settlement pattern changes, there are several possible statistical measurements available, although each of them has drawbacks. One approach would be to use the number of typed projectile points that have been identified for a given period as an index of prehistoric activity in the region. Chart 1 presents those counts of typed points, as they were reported in the data compiled by Basgall. There are large and more or less equal numbers of points pertaining to the Lake Mohave, Pinto, and Shoshonean periods, contrasted with substantially smaller numbers of Gypsum and Saratoga Springs period points.
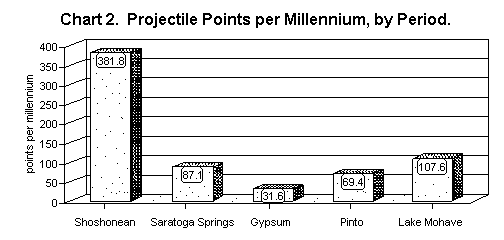
One evident drawback to this first statistic as an index of activity intensity is that it does not take into account the different lengths of time represented by the periods. That problem is easily corrected by dividing the raw counts by the estimated number of millennia represented by each time period. Chart 2 shows the results, which are a high relative frequency of Shoshonean points and only low frequencies for all of the other types. This modification makes the statistic a somewhat more realistic measure of the rate of activity at Fort Irwin during the various periods. However, it still suffers from at least two potentially important biases. One is that there may have been differences in the rates at which different kinds of projectile points were made and discarded. For instance, equal populations might very well have made and discarded considerably more Desert Side-Notched points than Lake Mohave points. Another potential bias arises from variability in the amount of archaeological work that has been done at particular sites. For example, Lake Mohave components at Fort Irwin may have more intensively sampled than Gypsum components. 
Table 1. Periods, Projectile Points, and Sites at Fort Irwin.
Period Projectile Points Recovered Number of Sites Midpoint Length (millennia) at Sites as Isolates Counts per Millennium Shoshonean 375 B.P. 0.550 207 3 33 60.0 Saratoga Springs 1075 B.P. 0.850 68 6 26 30.6 Gypsum 2750 B.P. 2.500 70 9 36 14.4 Pinto 5750 B.P. 3.500 239 4 19 5.4 Lake Mohave 8750 B.P. 2.500 263 6 28 11.2 All Periods 847 28 91 9.2 Based on data in Basgall (2000).
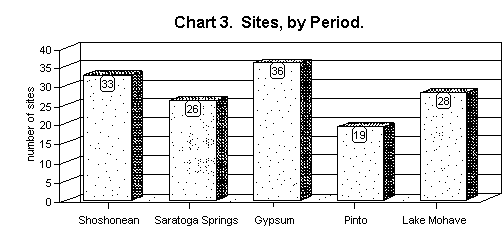
A third statistic that might be useful in this context is the number of archaeological sites containing typed points from each time period. Counts of sites are probably less biased with respect to differential discovery rates than are counts of points. Chart 3 shows the figures for site counts, which are relatively constant from Lake Mohave through Shoshonean times. The number of sites is perhaps something of a hybrid statistic with regard to settlement patterns, or at least it is an ambiguous one. A larger number of sites from a particular period might indicate that there was a larger population or more activity going on during that period. Alternatively, it might indicate that a stable or even a shrinking population was more dispersed in its settlement pattern. The present discussion will not try to separate out the dimensions of settlement intensity and dispersion, but will address a combined function of those two dimensions: intensity plus dispersion. 
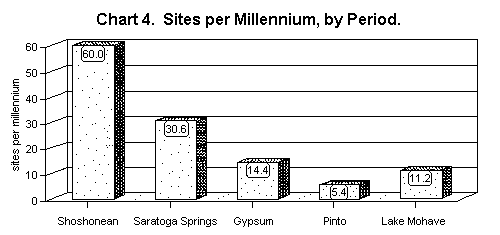
Basgall proposed to improve the site count statistic by dividing it by the number of millennia in each time period. Chart 4 shows the results. According to this approach, there is an accelerating rise in the number of sites per millennium, with Late Prehistoric sites about five to ten times more frequent than Early or Middle Holocene sites. Taken together with the apparently rather ephemeral character reported for many late-period sites, as contrasted with the more substantial character of earlier deposits, Basgall used this statistic to support his conclusion that Late Prehistoric settlement at Fort Irwin had become much more dispersed throughout the landscape. 
There are objections that can be raised to each of these last two statistics. Using the counts of sites per period as an index of settlement intensity and dispersal, as in Chart 3, would be completely valid if it were fair to assume that each site had been in essentially continuous use throughout the period in question, but that is not a reasonable assumption. Using the counts divided by the length of each period, as in Chart 4, would be valid if it were fair to make the diametrically opposite assumption--that each site had been in use only for a short interval, without being reused--but again, that is not a reasonable assumption. A better index for the settlement intensity-plus-dispersion dimension is likely to lie somewhere in between those two extremes, under an assumption that sites were not in continuous use, but neither were they used exclusively in single episodes. It is more reasonable to think that they tended to persist and to be reused at some intermediate rate. 
Given this conclusion, can a better estimate be made for the relative intensity plus dispersion of settlement, based on the available Fort Irwin data? This seems to be possible, by making use of the fact that many of the sites had projectile points from more than one period. From the inter-period rates of site reuse, it is possible to extrapolate meaningful estimates for intra-period rates of site reuse. Table 2 shows the frequencies with which points from different periods were found together in the same sites. Table 4 shows calculated indices of such associations. In Chart 5, the indices are plotted against the mean distance in time separating sites from each pair of periods. There is a strong negative correlation between the two variables--probability of site reuse, and distance in time. A least-squares linear regression provides a basis for estimating the probability of site reuse within a given period. The result of this calculation is a reuse index of about 0.477, or roughly 0.5, for short periods.
Table 2. Number of Sites with Projectile Points
Diagnostic for Pairs of Different Periods.
Saratoga Springs Gypsum Pinto Lake Mohave Shoshonean 13 12 2 2 Saratoga Springs 11 6 6 Gypsum 7 7 Pinto 12 Based on data in Basgall (2000:130).
Table 3. Mean Separations (in millennia) for Random Points of Time
between (or within) Periods.
Shoshonean Saratoga Springs Gypsum Pinto Lake Mohave Shoshonean (0.183) 0.650 2.375 5.375 8.375 Saratoga Springs (0.283) 1.725 4.725 7.725 Gypsum (0.833) 3.000 6.000 Pinto (1.167) 3.000 Lake Mohave (0.833)
Table 4. Indices for the Frequency of Site Reuse between Periods.
Saratoga Springs Gypsum Pinto Lake Mohave Shoshonean 0.500 0.333 0.105 0.071 Saratoga Springs 0.306 0.316 0.214 Gypsum 0.368 0.250 Pinto 0.429 Inter-period reuse indices are calculated as the number of sites having projectile points from both periods, divided by the number of sites having points from the earlier period.
Based on the data in Tables 3 and 4. The linear least-square regression is Y = 0.475 - 0.0433 X, where Y is the index of site reuse and X is the mean separation in millennia. The correlation is significant at the 0.99 level.
Using this reuse rate, Basgall's site frequency index of sites per millennium can be modified according the following formula:
Site Frequency Index = Number of Sites / Length of Period (1 - Reuse Index) = Number of Sites / Length of Period (0.5)
If reuse were at the maximum possible rate of 100%, with a reuse index of 1.0, lengthening the period would not result in the creation of any additional sites, and the site frequency index would simply be equal to the number of sites, regardless of the period length, as shown in Chart 3. If there were no site reuse, and the reuse index were therefore zero, the site frequency index would be equal to the number of sites divided by the period length, as in Basgall's formulation and in Chart 4. Using the estimated intra-period reuse index of 0.5, the result is shown in Chart 6. The conclusion is that Basgall's proposal of a proliferation of sites in the late period is still supported, but the increase is a more moderate one that was indicated in his calculation.
Reference Cited Basgall, Mark E. 2000. The Structure of Archaeological Landscapes in the North-Central Mojave Desert. In: Archaeological Passages: A Volume in Honor of Claude Nelson Warren, edited by Joan S. Schneider, Robert M. Yohe II, and Jill K. Gardner, pp. 123-138. Western Center for Archaeology & Paleontology, Publications in Archaeology 1. Hemet.
| Copyrights 2022 californiaprehistory.com | Back to the Top |